ESG Reports 101: Key Terms and Concepts Explained
ESG stands for Environmental, Social, and Governance, and an ESG report is a document that companies typically publish annually to present their ESG-related data publicly. The main goal of this report is to showcase these efforts to investors and consumers, fostering accountability and transparency.
And as we approach the end of 2024, we are witnessing ESG Reporting becoming more than a mere formality for companies. Moreover, these reports are now one of the crucial deciding factors for customers and investors making informed choices about where to buy or invest. A Gartner report from 2021 highlights this shift, revealing that nearly 85% of investors consider ESG factors when making investment decisions.
Thus, given its growing importance, understanding key ESG Report terms and concepts is essential before initiating your reporting process.
And that is exactly what this article will cover, so let’s dive in.
What are ESG Reporting Frameworks and Standards?
ESG Reporting Standards are globally recognized quality benchmarks that organizations must adhere to when preparing ESG Reports. They specify the metrics detailing 'what' a company needs to disclose to its stakeholders.
Examples: International Financial Reporting Standards (IFRS) Sustainability Disclosure Standards, Sustainability Accounting Standards Board (SASB) Standards, etc.
ESG Reporting Frameworks offer a structured way to present information, helping readers to understand and navigate complex ESG data in an organized manner.
Examples: Global Reporting Initiative (GRI) framework, Carbon Disclosure Project (CDP) framework, etc.
What are ESG Pillars?
They are the three core areas—Environmental, Social, and Governance—into which an ESG report is usually divided. Here is a rough overview:
-
Environmental
- Waste Management - Practices to reduce, recycle, and manage waste.
- Pollution - Measures taken to prevent and manage water, air, and soil pollution.
- Biodiversity - Impact on ecosystems and efforts to preserve biodiversity.
- Climate Change - Efforts to reduce greenhouse gas emissions and manage climate-related risks.
-
Social
- Diversity and Inclusion - Efforts to promote diversity in the workplace.
- Health and Safety - Measures to ensure the health and safety of employees and consumers.
- Community Engagement - Contributions to community development and well-being.
- Human Rights - Respect for human rights in operations and supply chains.
-
Governance
- Ethics and Compliance - Adherence to laws, regulations, and ethical standards.
- Transparency - Disclosure practices and how openly a company shares information with stakeholders.
- Board Structure - Composition and independence of the board of directors.
- Shareholder Rights - Protection of shareholder interests and transparency in decision-making.
It is important to note that the components (metrics) of these pillars can vary depending on the company, industry, jurisdiction, and reporting standards.
What are ESG Metrics?
Each Report contains metrics, which are performance indicators used to track a company’s ESG progress. Metrics can be both quantitative and qualitative. Quantitative metrics are measured in numbers or percentages, while qualitative metrics are more descriptive. These metrics are specific to the chosen ESG Reporting standards and frameworks.
However, some metrics are widely included in ESG reports across various industries, and a few of them are:
1. Greenhouse Gas (GHG) Emissions
The release of these gasses into Earth's atmosphere traps the sun's heat, causing global warming and climate change.
GHG emissions are divided into 3 categories:
Scope 1, Scope 2, and Scope 3.
Scope 1: GHG emissions from sources that are directly owned or controlled by a company.
Scope 2: It refers to indirect GHG emissions associated with the purchase of energy.
Scope 3: The outcome of activities from assets that the reporting organization doesn’t own or control, but that it indirectly impacts through its value chain.
2. Energy Consumption
Total energy used, including renewable vs. non-renewable energy.
This metric can be explained in detail by examining: Impact of energy efficiency initiatives on overall consumption, progress towards renewable energy targets, and energy consumption trends.
3. Water Usage
Total water withdrawn and used.
The metric can be further explained by considering: Improvement in water efficiency, water conservation initiatives, and changes in water consumption over time.
4. Waste Management
Total waste generated.
It can be further explained by: Amount of waste generated, waste reduction initiatives, recycling rates, and trends in waste management practices.
5. Diversity and Inclusion
Number of employees by gender, race, and ethnicity.
This metric can be further explained by: Percentage representation in the workforce and leadership roles, and effectiveness of diversity initiatives.
6. Board Diversity
Gender and ethnic diversity of the board of directors.
This metric can be further explained by: Percentage of board members who are women or from underrepresented groups, and trends in board diversity over time.
7. Employee Health and Safety
Number of workplace accidents and lost time injury rate.
It can be further explained by: Incidents per 100,000 hours worked, and the effectiveness of safety training programs.
8. Community Investment
Total amount invested in community programs and charitable contributions.
This metric can be further explained by: Dollars invested in community initiatives, and trends in community investment over time.
9. Data Privacy and Security
Number of data breaches and incidents of non-compliance with data protection regulations.
It can be further explained by: Number of data breaches or incidents, fines incurred, and the effectiveness of data protection and security measures.
Examples of ESG Reports to Connect the Dots
In this section, we will have a quick look at a few ESG Report snapshots from CleanTech, FinTech, and EdTech companies—highlighting the differences in their presentations and the frameworks they follow while connecting the concepts we have learned so far.
CleanTech
Company Name - Shell
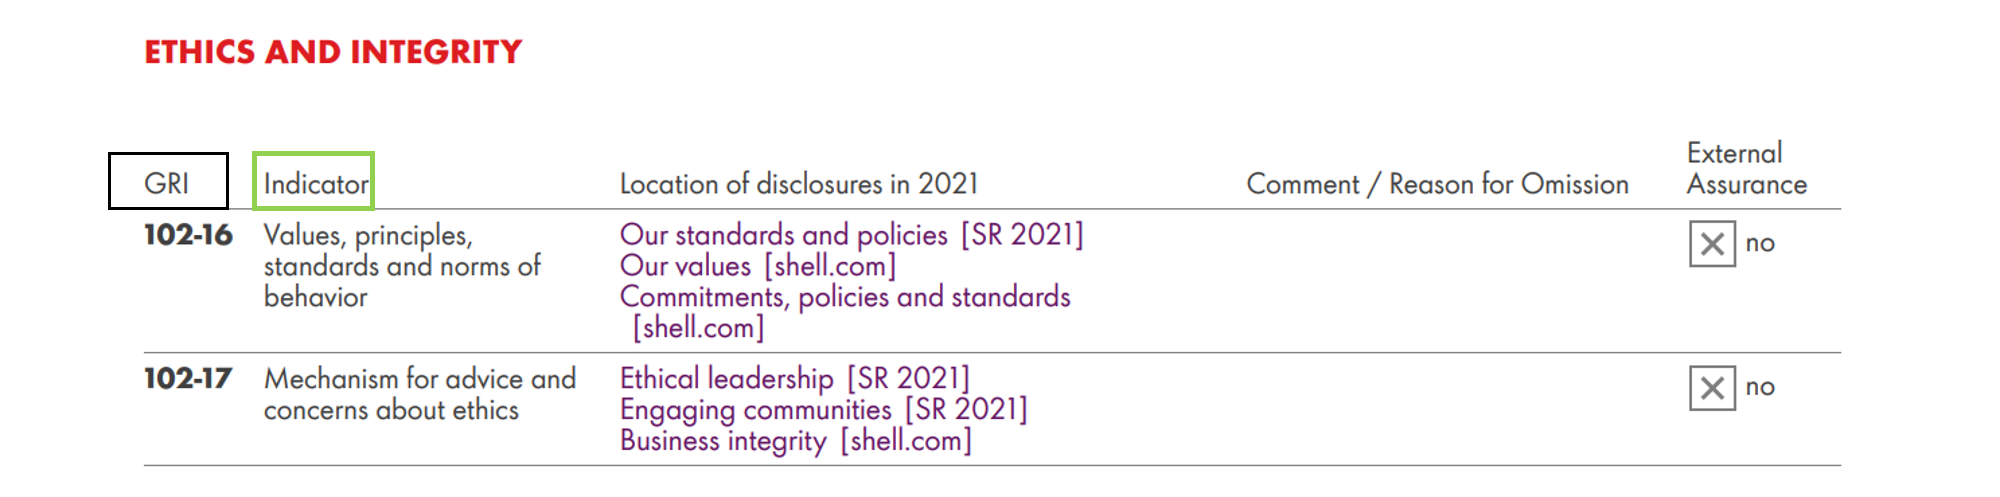
Note: The Black-bordered box represents → GRI Reporting Framework, the Green-bordered box represents → Key Performance Indicators.
To read Shell’s official ESG Report, click → here
FinTech
Company Name - Revolut
In this report, Revolut Group is using the UK's Streamlined Energy and Carbon Reporting (SECR) Reporting Framework to account for their GHG emissions.

To read Revolut Group’s official ESG Report, click → here
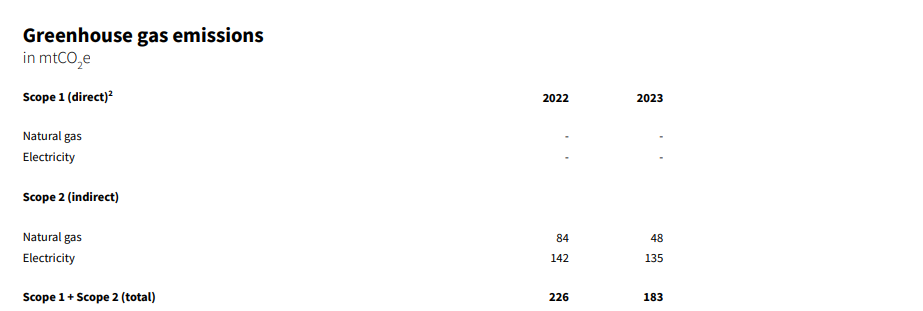
EdTech
Company Name - Coursera
In this example, the company is following the Greenhouse Gas Protocol Initiative principles set by the World Resources Institute and the World Business Council for Sustainable Development to calculate Scope 1 and Scope 2 GHG emissions.
To read Coursera’s official ESG Report, click→here
Conclusion
We have covered key terms, concepts, and industry-specific examples related to ESG Reports. And we hope that after reading this article, you will feel more confident exploring ESG Reporting in general.
Once you have made your choice regarding the reporting standard and framework, the next step is to initiate your ESG Reporting process. And for this, we suggest owning a robust ESG reporting system, as it can greatly enhance the reliability, adaptability, and clarity of your reports.
To learn more about how an ESG Reporting system can benefit you and how we can assist, please drop us a message at info@ideacrestsolutions.com